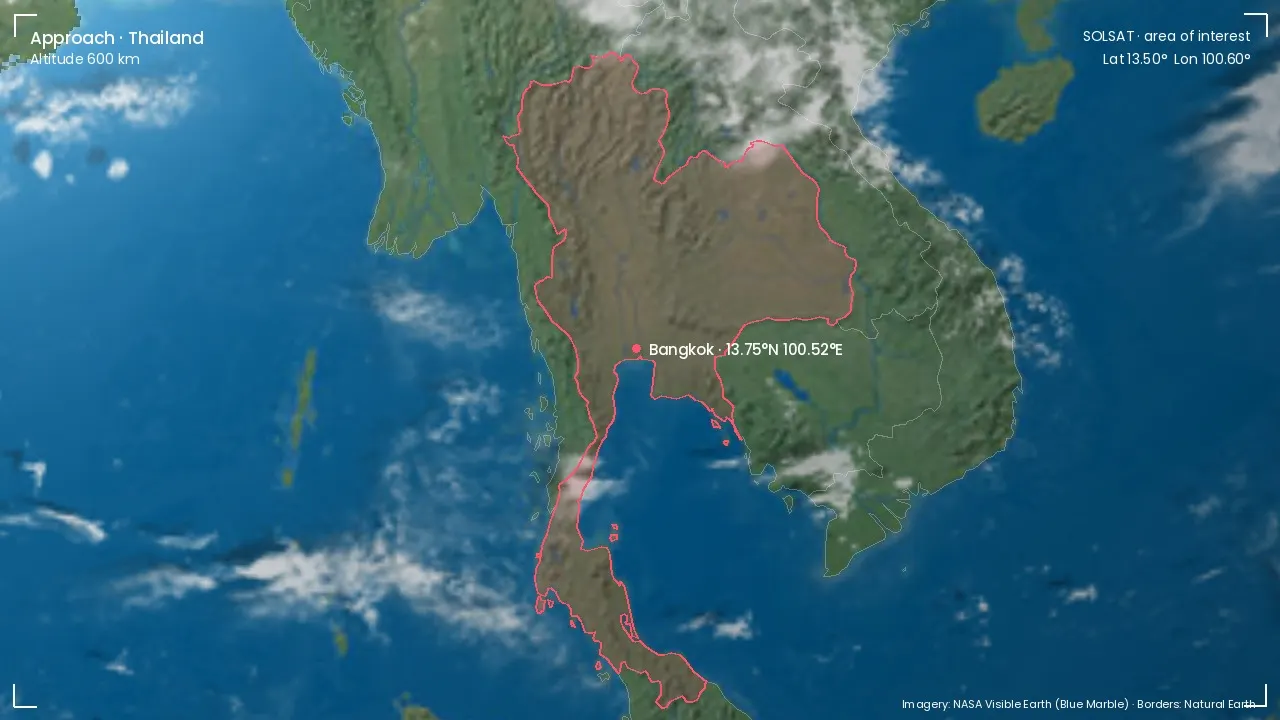
From satellite pixels to a clear answer.
SOLSAT turns satellite images into answers about a roof. AI models find the roof and its shade. A financial model then estimates the savings. Every answer shows its image date and its assumptions.
01
Observe
- Satellite images and sunlight data
- Aerial-style images (ortho imagery)
- Height maps of roofs and trees (digital surface models, DSM)
- Weather and Thai electricity rates (time-of-use tariff and Ft charge)
02
Understand
- AI image reading: roofs and obstacles
- AI forecast of sunlight
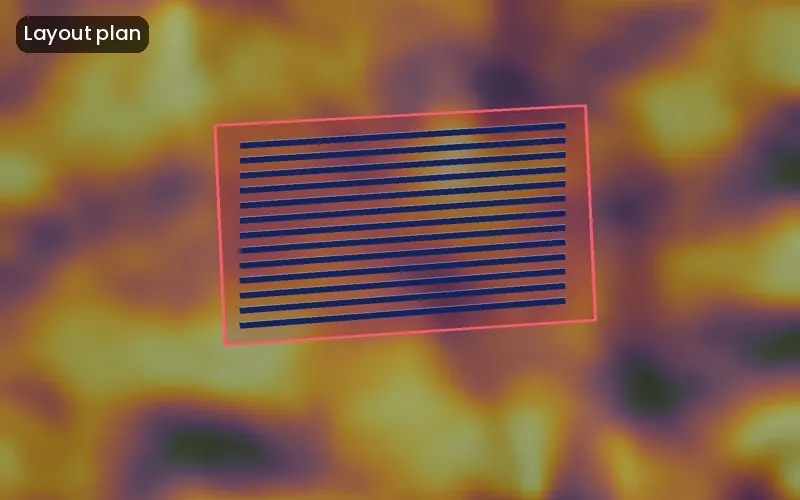
- Hourly shading & layout optimiser
- Financial model of the system
03
Decide
- Report & risk range
- Area scan & feasibility
- As-built check
- Monitoring & alerts
04
Act
- Installers
- Construction companies (EPCs) and developers
- Asset owners
- Banks & insurers
Real yield from customers can flow back into the engine to improve future forecasts.
How the models agree on one number
Brief: reuse the stacked-layer visual from the home hero. Each layer peels off in turn (imagery, segmentation, shade, irradiance, money) with that model’s role shown as it activates. Ends on the feedback loop arrow returning real yield to layer one.
We read solar sites from space.
Five capabilities, each labelled with its status. Select one to see what it does.
Roof segmentation
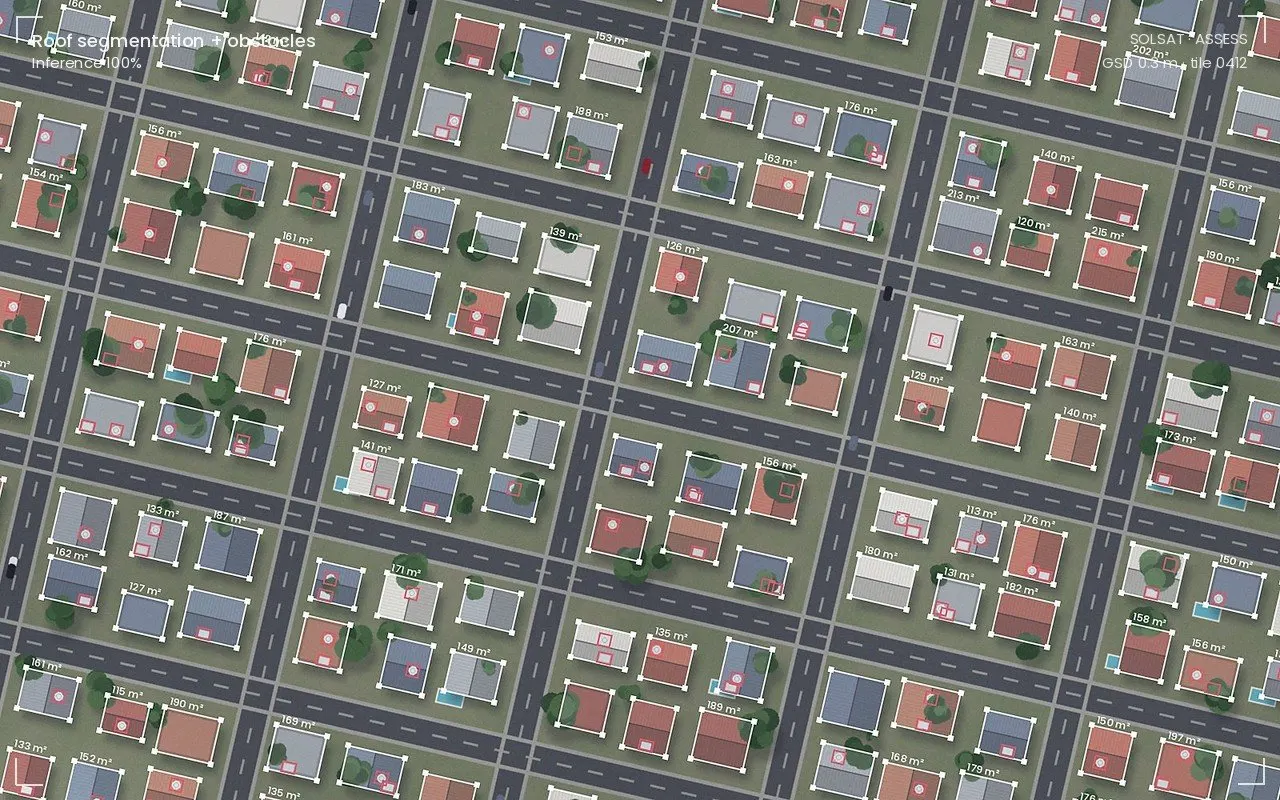
We find each roof plane in aerial-style images. We turn it into an outline. We measure the usable area after safety setbacks. Every later step builds on this outline.
Four layers, one pipeline.
Ingest
- Satellite imagery
- Aerial-style images (ortho)
- Height maps (DSM)
- Weather
- Electricity rates
AI models
- Roof and obstacle outlines
- Sunlight forecasting
- Shading & layout optimiser
Financial twin
- Savings and upkeep costs
- Degradation
- Many simulated outcomes
- Return on investment
Delivery
- Web and mobile app
- API for your software
- Your brand on our reports (white-label)
- Thai assistant

A payback range, not a promise.
Three quotes, three paybacks. Every estimator guesses differently. We treat each uncertain input as a range of values. We run many simulations and report the spread. This is an illustrative example, not a customer result. It shows a 5.4 kW home in Bangkok.
Annual yield
Bell curve · middle value 7,400 kWh · spread 4.5%
Assumption for this example
Electricity rate (time-of-use tariff + Ft charge)
Bell curve · 4.70 ฿/kWh · spread 3%
PEA/MEA tariff schedules
Self-consumption
Even spread · 90 to 100%
Customer bill + load profile
Tariff escalation
Bell curve · 1.5%/yr · spread 0.8%
Past trend of the Ft charge
Degradation
Bell curve · 0.5%/yr · spread 0.15%
Assumption for this example
System cost
Bell curve · 205,000 ฿ · spread 4%
Assumption for this example
5.8 to 7.1 years
฿279k
Worst ฿216k · best ฿352k
15.6%
Worst 13.7% · best 17.7%
฿30,946
5.4 kW
12 panels · ~7,400 kWh/yr
The model
E(t)   = E₀ · (1 - d)^(t-1)
S(t)   = E(t) · s · T₀ · (1 + g)^(t-1) - O&M
CF(t)  = Σ S(1…t) - CAPEX
Payback = min t : CF(t) ≥ 0      (interpolated)
NPV    = Σ S(t) / (1 + r)^t - CAPEX,   r = 5%, 25 yrs
P10 / P50 / P90 = percentiles over all draws
Why a range builds trust
- In this illustrative example, 80% of simulated outcomes fall between 5.8 and 7.1 years; customers see the downside up front.
- Lenders price risk on the worst case, not on one optimistic figure.
- Every assumption is listed with its source, so any estimator gets the same answer.
Illustrative example with assumed inputs, not a customer result. Real reports use site-specific values.
Accuracy is being validated.
We are validating SOLSAT against measured yield. Until then, each report shows its assumptions and imagery date, and a risk range instead of a single number.
Four things that are hard to copy.
Every customer adds real Thai yield data. Every data point sharpens the models. Better models win more customers.
Thai ground truth
Models calibrated with real Thai yield, monsoon and haze. Generic global models are not.
End-to-end chain
Chained models in one pipeline. Copying one is easy; making them all agree is not.
Uncertainty built in
Every number comes with a range from best case to worst case, so buyers trust it.
Data flywheel
Each monitored site sharpens the next forecast.
1 → 2 → 3 → 4 → back to 1
Built for buyers who audit.
Banks, insurers and enterprises need to know where every number came from.
Image date on every report
No hidden old imagery.
Assumptions listed
Every report lists the assumptions behind its numbers.
Embed the engine in your own product.
An API lets your software ask SOLSAT for an answer. White-label means reports carry your brand, not ours. Both are for solar companies and energy platforms.
- REST endpoints for assess, scan, verify and watch
- Image date and model version on every response
- White-label reports with your brand
curl https://api.solsat.tech/v1/assess \
  -H "Authorization: Bearer $SOLSAT_KEY" \
  -d '{"address": "Bang Phli, Samut Prakan",
       "monthly_bill_thb": 4200,
       "tariff": "PEA_TOU"}'
{
  "roof":    { "usable_m2": 41.6, "tilt_deg": 8, "azimuth_deg": 172 },
  "system":  { "panels": 12, "kwp": 5.4 },
  "yield_kwh_yr": { "p50": 7400 },
  "payback_yrs":  { "p10": 5.8, "p50": 6.4, "p90": 7.1 },
  "image_date":   "2026-09-18",
  "model_version": "assess-2027.1"
}
Illustrative · subject to change